Thursday 28 June 2018

Proteomics -Targeted proteomics

Biognosys’ label-free targeted proteomic workflows allow absolute quantification of up to 150 pre-defined proteins that can be analyzed in a high-throughput mode in thousands of samples. In contrast to HRM where all peptides and fragment ions are recorded, targeted proteomics limits the number of peptides that will be monitored and only focuses on those peptides during acquisition to achieve the highest sensitivity and throughput for hundreds or thousands of samples. Targeted proteomics allows absolute quantification of the proteins of interest by including stable isotope standards in the analysis.
Targeted proteomics currently relies on two main approaches: Multiple and Parallel Reaction Monitoring (MRM and PRM). MRM is a well-established method for targeted proteomics and is primarily performed on triple quadrupole mass spectrometers, while its novel variant PRM was introduced recently and is performed on the latest generation of high-resolution mass spectrometric instruments.


Targeted proteomics is based on three essential parts:

Assay development and set-up: This is the first step in targeted proteomics workflows and resembles spectral library generation in HRM. For the proteins of interest a collection of assays (also called transition or exclusion lists) is built and optimized. An assay describes the characteristic features of peptide spectra such as fragment ion intensities and retention time (iRT). These assays are later used in data acquisition.
Data acquisition: Data acquisition is performed on triple quadrupole (MRM) or high-resolution mass spectrometric instruments (PRM). In both approaches, an upfront quadrupole is used to isolate the targeted precursor ions from the assay list followed by a collision cell where product ions (transitions) are generated. While MRM only measures pre-selected transitions with the third quadrupole, PRM detects all product ions in a high-resolution mass analyzer increasing the number of quantifiable proteins in one run.
Data analysis is historically a limitation in high-throughput analysis of multiplexed MRM and PRM runs while a significant manual input is required with available tools. Biognosys overcomes these challenges with its proprietary software SpectroDive that features smartest peak picking algorithms and enables extremely fast analysis of large datasets.
Biognosys’ targeted proteomics platform is most suitable for verification or validation studies when many samples have to be analyzed for a pre-determined set of proteins of interest.

Reference : https://biognosys.com/technology

Wednesday 27 June 2018

Quantitative Proteomics in Precision Medicine

Traditionally, medicine has taken a “one-size-fits-all” approach to disease prevention and treatment strategies. However, as time has passed, and lessons have been learned, changes have begun to treat the individual rather than the average human. For many years, the need for administration of transfused blood from a donor with a compatible blood group to the recipient has been known but more recently greater attention has turned to look at other aspects.


We are all individuals, not only at the genetic level but in the environment in which we exist and lifestyles we lead, all of which are important factors in determining the diseases we may suffer and how effective the treatments are.  Hail the dawn of precision medicine, a system that takes into account all of these factors in tailoring predictive, preventive and treatment strategies to the individual.

A key part of this process has been understanding all the systems that contribute to a patient’s response; genetic, epigenetic, transcriptional, posttranslational modifications, metabolic, environmental, and proteomics.

Completion of the human genome and subsequent genome sequencing projects were a major step towards understanding differences between individuals. However, this is only one piece of the puzzle. Genetics cannot predict the diversity of protein expression patterns, modifications or how proteins may interact following translation. Therefore, studying the proteome of individuals and incorporating this information with genetic data has been key to advancing the field.

Protein expression is dynamic, correlates with disease timing, severity, and response to therapy. The proteome of a given tissue will not be the same during infection as it was prior to infection or during recovery and is therefore very informative for tailoring individual diagnostics and therapy. 


Mass spectrometry (MS) based quantitative proteomics has therefore emerged as an important tool in the precision medicine armoury, enabling known and unknown biomolecules to be identified in a single analysis. The sensitivity of the technology also enables discrimination between isoforms of the same molecule. Publication of the draft human proteome and subsequent publications of specific tissue proteomes are helping to build data that will enable comparative analysis. Comparison of patient samples with this database, or ultimately with the patient’s own archived healthy samples, would allow scientists and clinicians to associate changes in the proteomes with particular disease states and monitor responses to therapies. However, despite the promising results from this area, very few validated biomarkers or assays are available to doctors or patients currently, likely due to a multitude of factors.


Identifying Low Concentration Targets in Protein-Rich Samples


The identification of low concentration proteins within a complex sample, such as urine or blood has been one such hurdle. The presence of high molecular weight or high abundance proteins, such as albumin or immunoglobulins, in these samples, can overwhelm scarce proteins. Depletion or enrichment of these specimens by antibody purification or chromatographic separation has often been required, complicating and protracting workflows and increasing the opportunities for the introduction of sample bias or processing errors. Advances in technology however, such as developments in SWATH-MS which has a simplified workflow and has been successfully applied to a wide variety of biological samples1, will hopefully see improvements in this area in the near future.


Data Processing – Proteome Analysis, Interpretation and Metadata Integration


The complexity of the data generated has also been a stumbling block in introducing the technique to mainstream medicine. Unlike a PCR-based test or genetic screening, proteome analysis does not provide a simple yes/no answer but rather requires interpretation. Developers have now produced software, such as Simcyp and Gastroplus, that will enable protein quantification results to be merged with genetic information and physiological data, such as organ volume or body fat composition, to give a more integrated analysis. When it comes to assessing the pharmacokinetic and pharmacodynamic aspects of drugs on patients however, even these integrated software packages fail to fully incorporate the information relating to interindividual variability. A lack of well-characterized tissue repositories has also been highlighted as a gap that requires filling to enable satisfactory comparators for “unknown” samples.


Proteomic Biomarker Reliability 


Biomarkers have already been identified for a number of cancers, intestinal bowel disease and cardiac events as well as for rapid diagnosis of infectious diseases, including E. coli and Salmonella. However, the failure of identified biomarkers to apply over large populations is problematic and further work to verify and validate reliable biomarkers are clearly needed.


The implementation of proteomics as a clinical tool shows promise for the future of precision medicine, however there are clearly still challenges to be overcome in translating basic research into medicine. Most conditions incorporate multiple systems and cell types and so the identification and validation of biomarkers across many tissue types will be key to success.

Monday 25 June 2018

Rapid Proteomic Analysis

Rapid Proteomic Analysis for Solid Tumors RevealsLSD1 as a Drug Target in an end‐stage Cancer Patient

Recent advances in mass spectrometry (MS)‐based technologies are now set to transform translational cancer proteomics from an idea to a practice. Here, we present a robust proteomic workflow for the analysis of clinically relevant human cancer tissues that allows quantitation of thousands of tumor proteins in several hours of measuring time and a total turnaround of a few days. We applied it to a chemorefractory metastatic case of the extremely rare urachal carcinoma. Quantitative comparison of lung metastases and surrounding tissue revealed several significantly upregulated proteins, among them lysine‐specific histone demethylase 1 (LSD1/KDM1A). LSD1 is an epigenetic regulator and the target of active development efforts in oncology. Thus, clinical cancer proteomics can rapidly and efficiently identify actionable therapeutic options. While currently described for a single case study, we envision that it can be applied broadly to other patients in a similar condition.


Thursday 21 June 2018

Proteomics - Protein Dynamics

Quantification of Nuclear Protein Dynamics Reveals Chromatin Remodeling During AcuteProtein Degradation

Sequencing-based technologies cannot measure post-transcriptional dynamics of the nuclear proteome, but unbiased mass-spectrometry measurements of nuclear proteins remain difficult. In this work, we have combined facile nuclear sub-fractionation approaches with data-independent acquisition mass spectrometry to improve detection and quantification of nuclear proteins in human cells and tissues. Nuclei are isolated and subjected to a series of extraction conditions that enrich for nucleoplasm, euchromatin, heterochromatin and nuclear-membrane associated proteins. Using this approach, we can measure peptides from over 70% of the expressed nuclear proteome. As we are physically separating chromatin compartments prior to analysis, proteins can be assigned into functional chromatin environments that illuminate systems-wide nuclear protein dynamics. To validate the integrity of nuclear sub-compartments, immunofluorescence confirms the presence of key markers during chromatin extraction. We then apply this method to study the nuclear proteome-wide response to during pharmacological degradation of the BET bromodomain proteins. BET degradation leads to widespread changes in chromatin composition, and we discover global HDAC1/2-mediated remodeling of chromatin previously bound by BET bromodomains. In summary, we have developed a technology for reproducible, comprehensive characterization of the nuclear proteome to observe the systems-wide nuclear protein dynamics.

Reference : https://www.biorxiv.org/content/early/2018/06/14/345686

Study Identifies Protein's Role in Mediating Brain's Response to Stress


A study led by Massachusetts General Hospital (MGH) investigators has identified a critical role for a protein called Kruppel-like factor 9 (Klf9) in the brain's response to stress, which has implications for protecting against the effects of stress in conditions like major depression and post-traumatic stress disorder (PTSD). In their paper published in Cell Reports, the team describes finding that blocking the effects of Klf9 before but not during or after the induction of stress protected mice from the detrimental effects of stress on brain-cell structures called dendritic spines and on the animals' subsequent behavior.

"We have identified a -responsive transcription factor, Klf9, levels of which in the hippocampus mediate the detrimental effects of  on neuronal connectivity and ," says Amar Sahay, Ph.D., of the MGH Center for Regenerative Medicine and Department of Psychiatry, senior author of the report. "Our colleagues at Columbia University Medical Center, led by Dr. Maura Boldrini, also found this factor to be elevated in the hippocampus of women with a major depressive disorder who had been exposed to serious stressful events."


Traumatic, stressful events trigger the release of stress hormones including the steroids called glucocorticoids, sustained release of which can alter the structure of the hippocampus—the brain structure in which memories are encoded. These alterations, which have been seen in the brains of individuals with PTSD, have been shown to impair the brain's processing of stressful memories, potentially generating fearful responses to innocuous stimuli. Among hippocampal alterations are changes in the number and structure of dendritic spines, small protrusions from neurons that receive signals from adjacent cells and transmit them through the neuron. But little has been known about the stress-responsive transcription factors that regulate dendritic spine remodeling.

Previous studies have indicated that acute stress induces Klf9 expression, and the factor is known to be elevated in a hippocampal structure called the dentate gyrus of individuals with . To investigate the potential role of Klf9 in the stress-induced remodeling of dendritic spines and the fear response, the investigators developed a genetically engineered strain of mouse in which Klf9 expression in the hippocampus can be silenced. While their experiments showed that Klf9 expression was increased in the hippocampus and adjacent structures by acute stress—induced by physically restraining mice for several hours—that elevation did not continue when stress became chronic after the restraint protocol was repeated for 10 days.
In animals in which Klf9 was not silenced, two stress-induction protocols had different effects on males and females. Daily treatment with the glucocorticoid corticosterone for five weeks altered the fear response in males—leading them to "generalize" fearful memories into situations different from those in which they had learned to expect an unpleasant sensation—but not females. The chronic restraint protocol increased fearful responses in females, but not in males. Silencing of Klf9 expression prior to either stress protocol blocked both of those sex-specific responses to chronic stress and also prevented the enlargement of dendritic spines that was observed in stress-exposed Klf9-expressing mice, both males and females. However, Klf9 silencing after the initial, gender-specific stress protocol did not prevent altered fear responses after stress-induction was repeated in either males or females.
Previous studies of hippocampal tissues from patients with major depression had found elevated Klf9 expression but had not investigated the possible impact of sex, depression treatment and recent events. The Columbia team, led by Maura Boldrini, MD, Ph.D., analyzed tissues from 12 individuals with untreated major depression who had died suddenly—10 by suicide—and also had experienced serious, stressful events soon before their deaths. Klf9 expression was increased in the dentate gyrus of women but not men, and how much it was increased depended on the severity of the recent stressful event.
"Although it is known that women are more prone to major depression and PTSD, little is known about the molecular bases of sex differences underlying vulnerability and resilience to stress and stress-related psychopathologies," says Sahay, who is an associate professor of Psychiatry at Harvard Medical School and a principal faculty member of the Harvard Stem Cell Institute (HSCI). "Our study begins to illuminate the role of Klf9-dependent modulation of neural circuitry as one potential mechanism. A greater understanding of how Klf9 exerts these effects—which we hope to pursue—may identify treatment targets that confer resilience to stress for both women and men."

Wednesday 20 June 2018

Proteomics 2018

World Congress on Advancements in Proteomics and Bioinformatics Research

                                                                                                November 28-29, 2018                                                                                                                     Barcelona, Spain


Proteomics 2018 welcomes attendees, presenters, and exhibitors from all over the world to Barcelona, Spain. We are delighted to invite you all to attend and register for the “World Congress on  Advancements in Proteomics and Bioinformatics Research” which is going to be held during November 28 -29, 2018 Barcelona, Spain.


Tuesday 19 June 2018

Proteomics- Biomarkers


Description


Biomarkers of Kidney Disease, Second Edition, focuses on the basic and clinical research of biomarkers in common kidney diseases, detailing the characteristics of an ideal biomarker. The latest techniques for biomarker detection, including metabolomics and proteomics, are covered in the book.


This comprehensive book details the latest advances made in the field of biomarker research and development in kidney diseases. The book is an ideal companion for those interested in biomarker research and development, proteomics and metabolomics, kidney diseases, statistical analysis, transplantation, and preeclampsia. New chapters include biomarkers of cardiovascular disease in patients with CKD, biomarkers of Polycystic Kidney Disease, and biomarkers and the role of nanomedicine.
Key Features

Explores both the practical and conceptual steps performed in the discovery of biomarkers in kidney disease
Presents a comprehensive account of newer biomarker discover strategies, such as metabolomics and proteomics, all illustrated by clear examples
Offers clear translational presentations by the top basic and clinical researchers in each specific renal disease, including AKI, transplantation, cancer, CKD, PKD, diabetic nephropathy, preeclampsia, and glomerular disease

Sunday 17 June 2018

Pondering the Possibilities of Proteomics

The application of proteomics, or the analysis of proteins, to archaeology, is a fairly recent phenomenon – it only became viable thanks to developments in high-throughput, high-resolution tandem mass spectrometry – and archaeological scientists are only just beginning to scratch the surface of the many ways in which this technique might be used. Its potential is exciting, however.
One method, developed by Dr. Michael Buckley and Professor Matthew Collins at the University of York (Dr. Buckley is now at the University of Manchester), is called ‘ZooArchaeology by Mass Spectrometry’, or ZooMS for short. It uses proteins from small fragments of bone, ivory, or skin (including artifacts made from these materials) to identify animal species that might otherwise be indistinguishable: for example, the identification of the animals whose hide was used to make the York Gospels parchment (see CA 333).
Proteomics is also starting to be used to assess the contents of pots and other food vessels through the ‘residue’ left behind. While other studies, such as those carried out on the Chiseldon cauldrons (CA 214) and pots from Durrington Walls (CA 334) used lipid analysis, proteomics could potentially offer more specific results by being able to identify different parts of animals and plants, distinguishing between milk proteins, muscle proteins, structural proteins (namely, skin and bone), and keratins (hair and skin) from animals or seed proteins and root proteins from plants.
Slightly less well developed than ZooMS (which is quickly becoming an established method), but at a similar stage as food-residue analysis, is the use of proteomics to assess the composition of dental calculus. As emphasized in the previous issue’s ‘Science Notes’, teeth are one of the most informative parts of the human body, as they are relatively impervious to contamination and hold a plethora of clues about an individual regarding their diet, childhood origins, biological sex, and so on. But it is not just the teeth themselves that may be hugely helpful in reconstructing a person’s past: this new area of protein research is showing that the dental calculus – hardened, mineralized plaque – that forms on the surface of teeth, and the proteins found within it, may be equally important.
Based largely on an individual’s health, oral hygiene, and salivary composition, dental calculus can be found on most archaeological remains to a varying degree, from a small amount of calculus seen around the gum lines to a large amount present around the majority of the tooth. This calculus is like a time capsule, preserving oral bacteria, host DNA, and consumed food and inhaled micro-debris. Its analysis opens up new ways of studying ancient human microbiomes, dietary practices, genetics, immune response, pathogenic presence, and general health.
The technology to do this kind of analysis already exists and several projects have now successfully recovered ancient proteins from samples of dental calculus. These early studies have mainly set out to test the waters though, identifying individual aspects of the oral microbiome and showing that it is more than possible to find pathogens, DNA, and food molecules. For example, one avenue of research currently being investigated is the identification of milk proteins, which are robustly preserved in dental calculus, to assess the origins of dairy production and consumption.
The problem comes, however, in determining the standards for such analysis, particularly in terms of how much the quantity and/or quality of protein information varies between samples, as well as between sites. Without such information, it is impossible to use the sequenced proteins comparatively, meaning that while we might be able to say which proteins are present in the dental calculus of an individual, we are not yet able to say much about what this may mean in terms of health and/or diet at the level of a population.
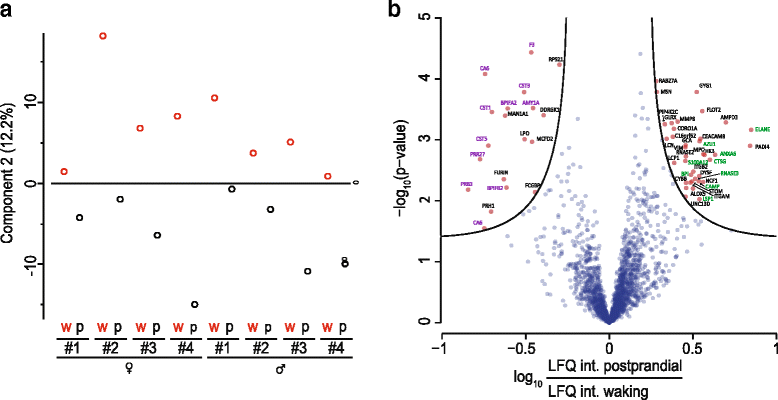
Recent experiments by Dr. Camilla Speller and a team from the University of York have examined the degree of variability between proteins able to be extracted from dental calculus. The results showed that there is substantial variation between individuals, but whether this is due to actual differences in the oral biome of each individual, the location of the calculus within the mouth, or degradation of the calculus over time is currently unknown. Additionally, while the researchers found that individual variability outweighed any inter-site differences, temperature and climate could still have their own effect on which proteins remain preserved.
To make this a more applicable technique, the team’s recent paper in Science and Technology of Archaeological Research stresses that, ‘more systematic studies exploring the quantity and quality of proteins preserved in both modern calculus, as well as a range of archaeological time periods, climatic zones, and burial environments, are required to differentiate and better understand individual variation and preservational biases’. Once the impact of these factors is fully appreciated, protein analysis of dental calculus could become one of the most informative types of analysis that can be done on human remains.
Reference: https://www.archaeology.co.uk/articles/pondering-the-possibilities-of-proteomics.htm

Wednesday 13 June 2018

Ultra-deep and quantitative saliva proteome reveals dynamics of the oral microbiome


Abstract

Background

The oral cavity is home to one of the most diverse microbial communities of the human body and a major entry portal for pathogens. Its homeostasis is maintained by saliva, which fulfills key functions including lubrication of food, pre-digestion, and bacterial defense. Consequently, disruptions in saliva secretion and changes in the oral microbiome contribute to conditions such as tooth decay and respiratory tract infections. Here we set out to quantitatively map the saliva proteome in great depth with a rapid and in-depth mass spectrometry-based proteomics workflow.

Methods

We used recent improvements in mass spectrometry (MS)-based proteomics to develop a rapid workflow for mapping the saliva proteome quantitatively and at great depth. Standard clinical cotton swabs were used to collect saliva form eight healthy individuals at two different time points, allowing us to study inter-individual differences and interday changes of the saliva proteome. To accurately identify microbial proteins, we developed a method called “split by taxonomy id” that prevents peptides shared by humans and bacteria or between different bacterial phyla to contribute to protein identification.

Results

Microgram protein amounts retrieved from cotton swabs resulted in more than 3700 quantified human proteins in 100-min gradients or 5500 proteins after simple fractionation. Remarkably, our measurements also quantified more than 2000 microbial proteins from 50 bacterial genera. Co-analysis of the proteomics results with next-generation sequencing data from the Human Microbiome Project as well as a comparison to MALDI-TOF mass spectrometry on microbial cultures revealed strong agreement. The oral microbiome differs between individuals and changes drastically upon eating and tooth brushing.

Conclusion

Rapid shotgun and robust technology can now simultaneously characterize the human and microbiome contributions to the proteome of a body fluid and is therefore a valuable complement to genomic studies. This opens new frontiers for the study of host–pathogen interactions and clinical saliva diagnostics.

Keywords

Oral CavityBacterial AbundanceBacterial ProteinTooth BrushingUnique Peptide

Background

Using saliva for the diagnosis of medical conditions would be particularly attractive because it can be collected non-invasively and economically [1], but the complexity of the oral cavity and the multiple entities contributing to its homeostasis make this challenging. In addition to the secretions of oral grands, saliva contains cells shed from the epithelium of the oral cavity and harbors the oral microbiome. Promising steps towards the establishment of saliva protein biomarkers have already been undertaken [23]. However, these studies either only considered around 100 proteins with antibody-based assays or employed relatively low throughput mass spectrometry (MS)-based proteomics with extensive fractionation, which generally precluded quantification [4].
Further interest in saliva has recently been fueled by the discovery that the oral microbiome and the gut microbiome are the most diverse ones of the human body and that they correlate well with each other [5]. There is now compelling evidence for a link between the human microbiome and conditions such as obesity, allergies, and even autoimmune diseases like multiple sclerosis [678]. In addition, tooth decay and other diseases of the oral cavity are known to be caused by bacteria but turn out to be insufficiently explained by one species alone [910]. Therefore, first metagenomics and then metaproteomics studies have already aimed to relate bacterial composition to caries incidence [1011]. However, reproducible identification and consistent quantification of bacteria remain challenging. Dynamic, quantitative studies would be of great help to uncover the functional connections between microbial communities and the prevalent pathologies of the oral cavity.
During the past few years, our laboratory has focused on simplifying and streamlining the proteomics workflow, with the aim of bringing the technology closer to clinical applications. Here we set out to characterize the saliva proteome at the greatest depth possible while still minimizing steps that could compromise quantification. We also developed a rapid single-run analysis workflow, starting from standard clinical cotton swabs and delivering results in a few hours, while retaining a quantification depth of thousands of proteins. This allowed us to investigate changes in the saliva proteome upon perturbation in a healthy cohort. We also analyzed inter-individual differences in the saliva proteome and quantitatively addressed the long-standing question of the degree to which the plasma and saliva proteomes are correlated. Finally, we asked if our in-depth workflow can characterize the oral microbiome and its dynamics and confirmed detected species by the established method of culturing followed by Matrix-assisted laser desorption/ionization time of flight mass spectrometry (MALDI-TOF MS) as well as data from next-generation sequencing projects.

Methods


Experimental design

We collected saliva at two different time points from four female and four male, healthy, non-smoking individuals aged 24 to 40 years with Caucasian backgrounds. All subjects were asymptomatic, did not take any drugs or antiseptics, visited the dentist regularly, and showed no signs of inflammation, bleeding, or infection as judged by a medical student (N.G.). The study was approved by the ethics committee of the Max Planck Society and all donors provided their written informed consent to participate in this study and to publish the acquired results. The first collection was immediately after waking, before eating, drinking, or tooth brushing. The second collection took place at 10 a.m., at least 30 min after the donors had eaten breakfast and brushed their teeth. In addition, we collected three samples immediately after one another from the same donor, processed them in parallel, and determined the reproducibility of our workflow. Because this showed very high reproducibility (mean R 2 = 0.92, Additional file 1: Figure S3b), we did not perform technical replicates in this study but decided to use our measurement time for the analysis of several donors and proteome states.

Protein digestion and peptide purification

Following collection, the swabs were transferred to an Eppendorf tube containing 200 Î¼l of lysis buffer (1 % sodium dodecyl carbonate (v/v), 10 mM tris (2-carboxyethyl) phosphine, 40 mM 2-chloroacetamide, 100 mM Tris buffer pH 8.5), thoroughly squeezed against the inner wall of the Eppendorf tube, and removed. We reproducibly recovered more than 100 Î¼g of protein in this way as estimated by the Bradford protein assay. Sample preparation followed essentially the in-StageTip protocol [12]. Briefly, a total of 20 Î¼g of protein was digested by adding 0.4 Î¼g trypsin and LysC to our lysis buffer and incubating for 60 min at 37 °C while shaking. Following this short digestion, we acidified the peptides to a final concentration of 1 % trifluoroacetic acid (TFA) and loaded them on an SDB-RPS StageTip [13]. The filter was then washed and peptides were finally eluted with 60 Î¼l 80 % acetonitrile (ACN) (v/v) and 1 % ammonium (v/v), dried in a SpeedVac concentrator, and resuspended in A* buffer (2 % ACN (v/v), 0.1 % TFA (v/v), pH 2) to a concentration of 1 g/l.

Single run and prefractionated liquid chromatography-MS measurement

To obtain a deep saliva proteome, we used basic reversed phase chromatography to fractionate our eight waking samples prior to liquid chromatography (LC)-MS measurement. Approximately 15 Î¼g of peptides were separated in an 80-min gradient on a 20-cm, 75-μm inner diameter column that was in-house packed with ReproSil-Pur C18 beads (Dr. Maisch GmbH, Germany). Concatenated fractions [1415] were dried in the SpeedVac concentrator and resuspended in A* buffer to a concentration of 1 g/l. Both the fractionated and the single run samples were subjected to a 100-min chromatography gradient using an EASY-nLC 1000 ultra-high pressure system (Thermo Fisher Scientific) and an in-house-made 40-cm column of the type described above. The chromatography was on-line coupled to a Q Exactive HF mass spectrometer (Thermo Fisher Scientific) by applying a spray voltage of 2.2 kV. The MS scan resolution was set to 120,000 at m/z 200, the scan range to 300 to 1650 m/z, and the maximum injection time to 55 ms. The 15 most intense ions per MS scan were selected for higher-energy collisional dissociation (HCD) fragmentation with an isolation width of 1.5 m/z and were measured at a resolution of 30,000. Dynamic exclusion was used with an exclusion time of 30 s.

Raw data processing of human proteins

The raw files were analyzed in MaxQuant [16] (version 1.5.3.15). We analyzed the single runs and the fractionated samples together in order to exploit the match between runs algorithm, which enables the identification of peptides that were not selected for fragmentation in one run by checking whether these peptides were sequenced in another run (the maximum time deviation was 30 s of the recalibrated retention times) [17]. We used the Andromeda search engine [18] to search the detected features against the human reference proteome from Uniprot (downloaded on 24 June 2015; 90.5 K sequences, 3.2 million unique peptides of which 0.64 million were seven amino acids or more in length) and a list of 247 potential contaminants [16]. Only tryptic peptides that were at least seven amino acids in length with up to two missed cleavages were considered. The initial allowed mass tolerance was set to 4.5 ppm at the MS level and 0.5 Da at the MS/MS level. We set N-acetylation of proteins’ N-termini (42.010565 Da) and oxidation of methionine (15.994915 Da) as variable modifications and carbamidomethylation of cysteine as a fixed modification (57.021464 Da). A false discovery rate (FDR) of 1 % was imposed for peptide-spectrum matches (PSMs) and protein identification using a target–decoy approach. Relative quantification was performed using the default parameters of the MaxLFQ algorithm [19] with the minimum ratio count set to 1.

Data analysis of human proteins

The “proteinGroups.txt” file produced by MaxQuant was further analyzed in Perseus (version 1.5.2.12). Proteins from the reverse database, proteins only identified by site, and contaminants were removed. We decided to consider all keratin type I and II proteins contaminants because we could not exclude the possibility that their presence in our samples was due to skin desquamation. Proteins were ranked according to the mean label-free quantification (LFQ) intensities of the fractionated waking and the postprandial samples of all donors. We performed one-dimensional (1D) annotation enrichment of the resulting logarithmized LFQ distribution for Gene Ontology (GO) terms and Uniprot keywords with a Benjamini–Hochberg FDR cutoff of 2 % as described [20]. For the comparison of plasma and saliva proteomes, we used triplicate plasma proteomes of two of our saliva donors measured with 45-min HPLC gradients [21]. These six raw files were processed together with the single run saliva files from the two donors using the MaxQuant settings from above. Principal component analysis (PCA) was done on the logarithmized LFQ intensities of all 16 single shot runs. The differences between the waking and postprandial proteomes were analyzed by filtering the list of quantified proteins for 100 % valid values in all 16 single run analyses and performing a two sided t-test on the logarithmized LFQ intensities with a Benjamini–Hochberg FDR cutoff of 5 % and the s0 parameter set to 0.1. We determined whether the significantly upregulated proteins at waking were enriched for certain Uniprot keywords compared with the entire proteome using a Fisher exact test with 2 % permutation-based FDR. The analogous analysis was performed for the significantly upregulated postprandial proteins.

Raw data processing of human and bacterial proteins

For the analysis of human and bacterial proteins, we downloaded the fasta files of all named species of the human oral microbiome database [22] with more than five protein sequences (downloaded 24 June 2015; 1118.9 K bacterial protein sequences in total). Together with the human sequences the resulting database contained 1209.4 K protein sequences which correspond to 58.6 million unique peptides after in silico digestion and 5.9 million peptides seven amino acids or more in length, which we considered in our MaxQuant settings. Search parameters were essentially identical to the raw file processing of human proteins alone, except that we applied the split by taxonomy feature on the phylum level and only used unique peptides for quantification. Due to the split by taxonomy on the phylum level, peptides that are part of human and bacterial proteins or peptides that occur in proteins from two different phyla are neglected for protein identification. This, as well as using only unique peptides rather than razor peptides for quantification, guarantees that peptides shared by different phyla are not attributed to the wrong organism.

Data analysis of the oral microbiome

For creating the taxonomic tree in Fig. 4, we determined the number of peptides that uniquely belonged to one species of our database and wrote this number above the respective edge of the genus. Peptides shared by certain genera were added to the number of the lowest taxonomy edge shared by these genera (Operating Taxonomy Unit). For Fig. 4 we excluded all genera that did not have at least one unique peptide. We extended the analysis for streptococci down to the species level. Bacterial genus abundance was estimated by adding the ten peptides of highest intensity per genus in analogy to the protein quantification in [2324]. Genera with less than ten peptides were excluded from quantification.

Co-analysis with whole genome sequencing data from the human microbiome project

To compare our data with results obtained from whole genome sequencing (WGS), protein multifasta (PEP) was downloaded from the Human Microbiome Project (HMP) [25]. Fractionated and single run raw files were analyzed with the MaxQuant settings described above against the human reference proteome from Uniprot and the fasta file from HMP (3.8 million protein sequences, 127.3 million unique peptides). From the genomic side we downloaded 764 fastq files from the HMP (release of 2012) and trimmed them using Trimmomatic [26] (we removed adapter as well as leading and trailing sequences with quality lower than 10 Phred quality score; we also did not accept reads for further analysis with lengths less than 36 nucleotides) and aligned using BWA with default parameters [27]. A PCA of the reads per genus of the WGS dataset together with the top ten peptide intensities per genus across the median of all samples from MaxQuant was performed after Z-score scaling within each sample (Fig. 5d). We combined the body sites “saliva”, “tongue dorsum”, “attached keratinized gingiva”, “palatine tonsils” and “throat” from the HMP for our definition of mouth because these sites clustered tightly in a PCA. Furthermore, we performed hierarchical clustering (Euclidean distance coupled with Ward’s agglomeration method was used) on the resulting dataset and visualized the genus abundance per sample in a heatmap (using the R package heatmap.2) (Additional file 1: Figure S1).

Microbiological processing of the samples

Together with the cotton swab collection after waking, all donors also collected whole saliva by passive drooling into a sterile tube. Samples were processed immediately after collection as follows. One Columbia and one chocolate blood agar plate for the aerobic and two Schaedler agar plates for the anaerobic culture were plated out with 50 Î¼l saliva each. Aerobic cultures were incubated for 3 days at 37 °C and 5.8 % CO2. Anaerobic cultures were grown under anaerobic conditions at 37 °C for a minimum of 5 days. Plates were evaluated visually and all morphologically different colonies were subcultured for identification by MALDI-TOF MS.

Identification by MALDI-TOF MS

Samples were measured in duplicates according to the standard protocol recommended by the manufacturer. In brief, a thin layer of bacteria taken from a single colony was smeared onto a polished steel target and overlaid with 1 Î¼l of matrix solution containing 10 mg/ml of α-cyano-4-hydroxy-cinnamic acid in 50 % acetonitrile/2.5 % TFA (α-HCCA portioned matrix, Bruker Daltonik GmbH, Bremen, Germany). For measurements, a Microflex LT benchtop instrument operated by flexControl 3.3 software (Bruker Daltonik GmbH, Germany) was used. Spectra were acquired in the linear positive ion mode at a laser frequency of 60 Hz within a mass range of 2 to 20 kDa. The acceleration voltage was 20 kV, the IS2 voltage was maintained at 18.6 kV, and the extraction delay time was 200 ns. For data analysis, spectra were matched with the Bruker Taxonomy database version 4.0.0.1.

Results and discussion


In-depth quantification of the saliva proteome

We obtained saliva from four male and four female healthy individuals using sterile cotton swabs as is done in routine clinical practice (Fig. 1, “Methods”). Donors were required to abstain from eating and drinking for at least 30 min prior to the collection to avoid food-based contamination or dilution effects. They were instructed to wipe the vestibule of the oral cavity, followed by the teeth and the sublingual compartment. Around 200 Î¼g of total protein was recovered from each swab, an ample amount for repeated measurement using our recently developed in-StageTip digestion procedure [12]. Following an immediate digestion for one hour and purification, the resulting peptides were separated into eight fractions with basic reversed-phase chromatography [1415]. Each fraction as well as unfractionated sample was measured with a 100-min LC gradient on a Q Exactive HF mass spectrometer [2829]. Data were analyzed using the MaxQuant environment [1619].

Figure 1
Fig. 1
Workflow for ultra-deep and quantitative saliva proteomics. (1, 2) Saliva is collected with a sterile cotton swab and its proteins are denatured, digested, and purified according to the iST protocol [12]. (3) Depending on the desired proteome depth, samples are either separated into eight fractions or directly measured in single runs. (4) Peptides are measured by liquid chromatography–tandem mass spectrometry (LC-MS/MS). (5) MaxQuant identifies and quantifies the proteins and enables statistical analysis in the Perseus software environment. The required time for each of the steps is indicated below each panel
Across our eight donors we identified more than 54,000 sequence-unique peptides and more than 5500 proteins, both at a false discovery rate (FDR) of 1 %. A total of 78 % of these proteins were detected in each donor, 90 % in at least six of eight donors, and only 1.3 % were unique to single donors (Fig. 2a). Thus, our sample collection protocol is robust and allows comparison of thousands of saliva proteins across individuals. For an individual donor, we identified a remarkable 5213 human proteins in the eight fractions—to our knowledge the deepest body fluid proteome recorded from an individual to date (Additional file 1: Figure S2a). To investigate the reasons for this extensive coverage, we inspected the MS signal of the most abundant proteins. Unlike other body fluids, the 15 most abundant proteins in saliva make up only 32 % of the total proteome mass (Fig. 2b), whereas in plasma and urine they already account for more than 90 % and 58 % of the total, respectively [3031].

Figure 2
Fig. 2
Deep human saliva proteomes of eight healthy donors. a Ovals represent the number of saliva proteins shared by the respective number of donors. The outer oval contains all proteins that were detected in at least one donor, whereas the inner oval contains all proteins found in each sample—the core proteome. The numbers on the right indicate the numbers of proteins exactly found in one donor, in two donors, and so on. b Gene names of the 15 most abundant saliva proteins, their coefficients of variation (CVs) across eight donors at waking (w) and after breakfast and tooth brushing (p), as well as their abundances in percentage of the total proteome and the cumulative protein abundances (cum. amount). The proteins in blue are digestive proteins, the proteins in green are part of immune defense, and the proteins in red are of epithelial origin. c Dynamic range plot of the saliva proteome with some key proteins in saliva highlighted in red. Significantly enriched GO terms or Uniprot keywords in specific abundance regions as determined by 1D annotation are listed. d Scatter plot of the LFQ intensities of the saliva proteome and the plasma proteome
The abundance ranked plot of the entire measured saliva proteome spans a dynamic range of six orders of magnitude of estimated absolute abundance (Fig. 2c). To bioinformatically investigate the saliva proteome as a function of abundance, we used 1D annotation enrichment in the Perseus environment for GO terms and Uniprot keywords [20]. “Antibacterial humoral response” and “defense response to bacterium” scored in the upper part of the abundance distribution (Fig. 2c). “Extracellular space” and “Extracellular exosome” were significant near the median, indicating that proteins making up this category are somewhat less abundant than most of the functional saliva proteins. The terms in the lowest abundance range included typical intracellular terms such as “cytoplasm” and “mitochondrial translation”.
There is an ongoing debate as to the extend that easily obtainable saliva could be used to measure plasma biomarkers by proxy [32]. We measured the plasma proteomes of two of our saliva donors in singe-run triplicate measurements [21] and compared them with the single-run saliva proteomes of the same donors. Due to the dynamic range challenges, fewer proteins were identified in plasma but more than 50 % of these were also identified in saliva. A scatter plot of the label-free quantification (LFQ) intensities of the proteins [19] that were identified in both body fluids reveals little correlation between these values (R 2 = 0.11; Fig. 2d). Over the two individuals and all replicates, it was never higher than R 2 = 0.20. We also considered the possibility that particular saliva components might show a higher correlation with the plasma proteome and collected one saliva sample from the opening of the duct of the parotid gland, one from the opening of the sublingual and submandibular gland, and one from gingiva. All these saliva proteomes revealed R 2 values below 0.1 (Additional file 1: Figure S3). Thus, we conclude that the plasma and saliva proteomes show little overall correlation and that saliva cannot directly be used as a substitute for the determination of plasma protein levels.
To make our saliva results available to the community in a user-friendly format, we uploaded them to the MaxQB database [33]. For each protein of interest, a query will reveal whether it is present in our saliva proteome, its abundance rank, estimated absolute abundance, and other protein level information (Additional file 1: Figure S2b). Additionally, peptide evidence leading to protein identification as well as high-resolution precursor–fragment relationships are available for constructing targeted assays. The protein illustrated in Additional file 1: Figure S2b is transcobalamin-1 (TCN1), which is known to be secreted by the salivary glands and to protect cobalamin or vitamin B12 against acidity of the stomach. In addition, TCN1 functions as a transport protein in the blood, carrying excess cobalamin to the liver for storage. Cobalamin deficiency occurs in 20 % of individuals over the age of 60 years [34] and causes anemia, demyelinating disease, or both [35]. Due to cobalamin’s clinical significance, the physiological levels of TCN1 in blood have been characterized extensively in dedicated studies [3637], whereas here its levels are determined in the context of our system-wide investigation of thousands of other saliva proteins.

A deep single-run workflow

The high proteome coverage achieved using fractionation motivated us to determine how much of the saliva proteome could be retrieved in a single-run or “single-shot” experiment [17]. We used the same 100-min gradients as before and measured saliva proteomes from the eight individuals mentioned above, each at two different time points, once immediately after waking before tooth brushing and once post-prandial after tooth brushing. Remarkably, an average of 3835 proteins could be identified and almost all of them (94 %) were also quantifiable (Additional file 1: Figure S4a). The results from three swabs taken at nearly the same time and processed independently but equally were highly similar with a mean coefficient of determination R 2 of 0.92 (Additional file 1: Figure S4b). The difference between individuals was somewhat higher, with an R 2 of 0.89, indicating that biological differences between individuals can also be captured by single-run measurements. Plotting the CVs for saliva proteome variation between the individuals showed that they did not primarily depend on protein abundance (Additional file 1: Figure S4c). This suggests that single-run analysis should be able to determine biological differences across a wide abundance range. As the single-shot proteome still quantifies more than 3700 proteins, which include nearly all the functional categories described above, very rapid and medium throughput characterization of saliva may be possible in the clinic.

Dynamics of the saliva proteome in a cohort

The oral cavity is subject to a variety of conditions in daily life. Despite several studies investigating, for instance, changing cortisol levels [38], to our knowledge intraday changes in the saliva proteome have not yet been investigated in depth.
To uncover dynamic changes, we first performed a principal component analysis (PCA) on all 16 single-run proteomes. Component 1 of the PCA separated weakly by sex (Additional file 1: Figure S5), whereas component 2 separated the two proteome states (waking versus post-prandial after tooth brushing) and this difference was even more pronounced when inspected on a person-by-person basis (Fig. 3a). To determine the proteins responsible for the PCA clustering, we filtered for 100 % valid LFQ values and plotted significance (5 % FDR) versus fold change (Fig. 3b). The proteins that were significantly upregulated at waking were enriched in the keywords “antibiotic” (p = 7.7 × 10⁻⁹, enrichment factor (ef) = 33) and “antimicrobial” (p = 6.6 × 10⁻⁸, ef = 24). The proteins with significantly higher abundance in the postprandial state were enriched for the terms “thiol protease inhibitor” and “secreted” (p = 3.3 × 10⁻⁵, ef = 42, and p = 8.7 × 10⁻⁹, ef = 6, respectively). Serving as a positive control, levels of alpha amylase (AMY1A), a protein that initiates the breakdown of complex oligosaccharides, were consistently upregulated after the meal. Thus, the shifts in protein abundance between our two measurement time points demonstrate that MS-based proteomics can now robustly capture biologically meaningful dynamic changes in body fluid proteomes.

Figure 3
Fig. 3
Intraday dynamics of the human saliva proteome. a PCA of the 16 saliva samples showing that component 2 separates samples based on the collection time (w = waking and p = postprandial). bDifferentially regulated proteins between w and p as determined by plotting the t-test significance (5 % permutation-based FDR) versus the logarithmized fold change of LFQ intensity (volcano plot). Protein data points are labeled by their gene names. The green gene names indicate genes with the Uniprot keyword “antibiotic” or “antimicrobial”, the purple gene names indicate proteins with the Uniprot keyword “secreted”

Identification of bacterial proteomes in human saliva

Due to the prominent role of the oral microbiome in health and disease, we investigated whether we could detect bacterial species in the deep saliva proteomes. For this purpose, we downloaded the complete Uniprot protein sequences of all named oral bacterial species that had been identified by 16S rRNA sequencing in a recent study [22]. The resulting database was about 11 times larger than the human one alone.
In metaproteomics it is not straightforward to assign peptides to bacterial phyla because some amino acid sequences are part of proteins from different phyla. We addressed this issue by applying the “split by taxonomy” feature in MaxQuant, which avoids the formation of protein groups between different phyla. Together with the exclusive use of unique peptides for protein quantification, this functionality prevents the same peptide from contributing to the identification and quantification of proteins in different phyla (“Methods”). Split by taxonomy id is, therefore, relevant only for protein identification but not for peptide identification or quantification. However, bacteria in the oral cavity can have substantial sequence identity (Additional file 1: Figure S6a, b) [39]. As closely related bacteria share many sequences, one therefore needs to find the most appropriate taxonomy rank for applying the split by taxonomy id. To address this question, we placed identified bacterial peptides on a taxonomic tree such that the number of shared peptides is noted on each branch (Fig. 4). These shared peptides do not allow discrimination of the branches below. Split by taxonomy at a certain taxonomic rank prevents peptides shared at the ranks above from contributing to the identification of proteins. As in the case of human and microbial proteins above, this prevents the misassignment of peptides to phyla from which they do not necessarily originate. Placing the split at the phylum level turned out to be a good compromise between use of peptides for identification and quantification on the one hand and stringency of identification of bacteria on the other hand (Additional file 1: Figure S6) and we used this setting for all following analyses.

Figure 4
Fig. 4
Taxonomy tree of 50 bacterial genera with evidence at the peptide level. The number of peptides that were specifically attributable to this position on the taxonomic tree are given above the edgesof the graph. Genera in bold were also detected after bacterial culture of the saliva samples followed by MALDI-TOF MS measurement. For the genus Streptococcus the tree is extended down to the species level
The presence of bacteria in the oral cavity also raises the question of whether proteins from them might considerably impair the human protein quantification presented above. To address this question we determined the nonredundant tryptic peptides that were seven or more amino acids long in our human and our oral bacteria database, which is the minimum length considered in our analysis. Among these tryptic peptides, the percentage of peptides with identical sequences between humans and bacteria was only 0.043 % (Fig. 5a). Hence, the quantification bias of human proteins due to bacteria is marginal. This analysis also indicates that bacterial contamination of mammalian proteome samples does not impair protein quantification considerably as long as only peptides of seven amino acids or more in length are considered.

Figure 5
Fig. 5
Quantitative distribution of bacterial proteins. a Number of nonredundant tryptic sequences considered in our MaxQuant search space for human (violet) and oral (green) bacteria. The percentage of shared peptides between human and bacteria among all nonredundant peptides in our search is 0.04 %. b Dynamic range plot of the saliva proteome searched against a combined human and bacterial sequence database. The protein density is color coded and the names of the most abundant proteins are given. c The sum of the top ten peptide intensities per genus serves as a quantitative measure of genus abundance. The 20 most abundant genera are depicted. d PCA of whole genome sequencing (WGS) data from the human microbiome project (HMP) co-analyzed with our saliva proteome data (MSMS). The MS-based proteomics data (MSMS) tightly co-localizes with the mouth sites from the human microbiome project
Similarly, ingested proteins from food could, in principle, be erroneously assigned to human or bacterial proteins. To estimate the magnitude of these effects, we performed an analogous analysis on bovine and wheat as representative parts of a Western breakfast diet and determined the number of sequence identical peptides to humans and bacteria (Additional file 1: Figure S7). Except for bovine and human the percentage of overlapping peptide sequences is far below 1 %. Due to an overlap of 20.7 % among the considered human and bovine peptides, our in silico analysis does not exclude the possibility of quantification bias. However, proteins that substantially differ between waking and the postprandial state in Fig. 3 do not include proteins from human milk or human muscle, as would be expected if these differences were due to a bovine diet.
Remarkably, a search of our deep saliva proteome data sets using our standard, stringent search criteria (1 % FDR at the peptide and protein levels) resulted in the identification of 2234 different bacterial proteins. In total, we found evidence for 50 different bacterial genera from nine different phyla. This represents 50 % of the named genera identified by next-generation sequencing with corresponding, annotated UniProt proteomes and therefore present in our database. The proteomic coverage of bacterial genera is remarkably high given the restricted database and the modest measuring time. The distribution of peptides specific for particular genera was highly unequal, ranging from only 1 to 1069 for the genus Streptococcus, for which Fig. 4 shows a detailed taxonomic tree down to the species level. At least 12 different such Streptococcus species were present in our deep saliva proteome. The most abundant species was Streptococcus mitis, but we also detected peptides unique to Streptococcus mutans, a main contributor to dental caries formation.
Standard MALDI-TOF MS as now routinely used in clinical microbiology found evidence of 14 different genera in our saliva samples, with an average of six genera per donor (“Methods”). In each case, shotgun proteomics had also identified the genus in the same sample without the need to cultivate the bacteria prior to processing. A rough comparison with the number of MS-identified peptides for genera identified by MALDI-TOF MS suggests that they were generally the more abundant ones (Fig. 4). While the goal in clinical microbiology is to identify the presence of one or a few pathogens responsible for an infection, rather than a total inventory of the microbiome, it is nevertheless notable that unbiased and relatively straightforward shotgun proteomics of saliva identified these bacteria without intervening cultivation directly from a cotton swab. This identification would presumably have been much easier still in the case of a dominating pathogen.

The quantitative oral metaproteome

To further investigate the unexpectedly large number of bacterial protein identifications, we plotted their cumulative percentage as a function of abundance rank (Additional file 1: Figure S8). Among the first 1000 proteins only 5 % were bacterial proteins. This proportion increased steadily until it reached 35 % for the total set of about 6000 proteins. Expressed as the percentage of bacterial proteins per 100 proteins, the chance to identify bacterial proteins reached more than 50 % towards the limit of detection. This suggests that increasing the depth of proteomic analysis would preferentially uncover further bacterial proteins and that our coverage of the oral metaproteome is far from saturation. As the depth of our bacterial detection increases in the future, it may also be possible to analyze bacterial pathways and how they change across different conditions of the oral cavity.
The simultaneous detection of bacterial and human proteomes in our samples allowed us to directly compare them quantitatively (Fig. 5b). The most abundant bacterial protein was F1WNZ3, the Moraxella catarrhalis homolog of chaperone protein HscA, which is involved in maturation of iron-sulfur-containing proteins. Its abundance was only 100-fold lower than the top human protein, alpha-amylase 1. Further highly abundant proteins of the bacterial metaproteome included proteins with household functions, such as A0A096BHY1, which is a glyceraldehyde-3-phosphate dehydrogenase, or E0Q9Q6, a subunit of DNA polymerase III. Sequence alignment in Perseus showed that many of the very abundant bacterial proteins were highly conserved. Therefore, peptides from different species likely contribute to their abundance.
The number of significantly identified human proteins decreased to about 4000 in the combined search space (Fig. 5b). Thus, almost a third of the overall protein count of 6197 is due to the microbiome. The bacterial proteins originated from four main phyla, with 300 to 800 uniquely assigned proteins, each of which spanned the entire abundance range (Additional file 1: Figure S9). In analogy to the top-three-peptide method commonly used in label-free abundance estimation of proteins [2324], we defined an approximate quantitative measure of the abundance of a bacterial genus as the summed MS intensity of the top ten most abundant peptides across all samples. These data were available for nearly all genera and, as in the protein case, comparing just the ten highest peptide intensities should be a better measure than summing all peptides, which would tend to overestimate abundance differences. The top ten peptides were determined among all peptides of a genus, not just unique peptides. This comes at the disadvantage that peptides shared by two genera could lead to an overestimation of the taxon’s abundance. Considering only unique peptides would have put genera with large sequence identity at a great disadvantage compared with genera with relatively distinct peptide sequences. However, this shows that adequate quantification of bacterial genera by their proteomes is challenging and at the present coverage our quantitative readouts should be considered as approximations rather than exact quantifications.
We applied our bacterial quantification measure to all detected genera and plotted the abundance of the top 20 (Fig. 5c). As expected from quantification performed by 16S RNA sequencing [4041], Streptococcus was the most abundant genus. The top ten genera did not show drastic differences in abundance (the integrated MS peptide signal of the top ten peptides was 4.0 × 10¹⁰ for Streptococcus and 1.4 × 10¹⁰ for Lactococcus). While we believe that the quantitative trends between bacteria are correct, more accurate quantification would require deeper sequence coverage of the bacterial proteomes.
The Human Microbiome Project (HMP) has generated large datasets of human microbiomes using next-generation sequencing [25]. We compared our quantitative bacterial proteomes with the whole genome sequencing data of the HMP in a PCA (Fig. 5d) and a heatmap of genera against samples (Additional file 1: Figure S1). The different body sites clustered separately in the genome data, with our proteomic data strikingly co-localizing with the oral microbiome. We did not expect such close co-localization given that both datasets originate from different samples and individuals. However, these results are in agreement with previous findings showing that the oral microbiome has relatively low diversity among individuals (beta diversity) [25]. The human microbiome study had collected samples from different locations in the mouth, but these data cluster together in the PCA, suggesting that the microbiome is similar throughout the oral cavity.

Variation and dynamics of the metaproteome

Apart from estimating bacterial abundances, our data allow a quantitative comparison of the same genus upon perturbation or across individuals. Overall, individuals varied little in their bacterial diversity in accordance with the HMP [25]. A scatterplot of two typical donors reveals that bacterial abundances are similar for many of them, with a strong mean R 2 of 0.82 (Fig. 6a shows a typical scatter plot). However, there are also genera that varied up to tenfold.

Figure 6
Fig. 6
Bacterial composition across donors and time points. a Typical scatter plot for two donors of the bacterial genera quantified by the sum of their top ten peptide intensities from fractionated proteome measurements. The eight most abundant genera are color coded. b Absolute quantification of the eight most abundant bacterial species depicted for each individual donor and (c) normalized to 100 %. d Mean genus quantities between males and females treated as groups from single run measurements. e Comparison of mean bacterial abundances at waking to the mean bacterial abundances in the postprandial state. f Reduction in bacterial abundance between the waking saliva samples and the postprandial samples
The cumulative abundances of the top eight bacterial genera across all donors indicate differences in total bacterial mass of up to threefold (Fig. 6b). Variation in the relative abundance of genera is much smaller (Fig. 6c) and the same analysis at the level of the five most abundant phyla showed similar variation.
When aggregating males and females separately, the two groups exhibited very comparable bacterial abundances that were highly correlated (R 2 = 0.94; Fig. 6d). Thus, proteomics indicates that sex differences in the oral microbiome are minor. In contrast, bacterial abundance changed drastically after eating breakfast and tooth brushing. The high abundance bacterial genera were reduced 2.5-fold on average, while the lower abundant ones generally showed even stronger reduction (Fig. 6e, f). The Streptococcusgenus, which contains S. mutans, was reduced by almost threefold after tooth brushing (Fig. 6f). It has been established that the S. mutans species is not the only one involved in cavity formation [42] and it would now be interesting to study the effects of different oral hygiene regimes on the oral bacterial community at the proteome level.
Our deep saliva proteomes also allow combined analysis of the human and bacterial proteome changes in response to the same perturbations. For instance, at waking, when bacterial abundance is high, the human saliva proteome was primed towards bacterial defense with substantial enrichment of proteins annotated with the Uniprot keywords “antibiotic” and “anti-microbioal”. Given the higher abundance of the microbiome at waking, this likely reflects the body’s effort to limit bacterial proliferation during the night when these populations are relatively undisturbed. This example illustrates the utility of the simultaneous detection of the human and bacterial proteomes for the study of the interplay of the host and microbiome.

Conclusions

Here we employed shotgun proteomics with a state of the art workflow and identified more than 5500 proteins, the largest number of human proteins in a body fluid to date. Comparison with the plasma proteome established that the quantitative protein levels do not correlate.
We showed that shotgun proteomics can now readily determine 50 bacterial genera in saliva but the sequence coverage of bacterial proteins and organisms suggests that we have only scratched the surface of the oral bacterial proteome. Quantitative comparison to next-generation sequencing data from the HMP [25] revealed excellent agreement, suggesting that proteomics could provide a valuable complement to sequencing-based measurements of the human microbiome. Furthermore, proteomics appears uniquely positioned to study the interplay of the human immune system with commensurate and pathogenic bacteria on the protein level. With improving technology, our workflow might even become attractive for clinical microbiology since bacteria do not need to be grown and rapid bacterial resistance testing could become possible by directly measuring proteins that confer resistance to antibiotics. An important task for the future is to better characterize and annotate bacterial sequences in order to provide comprehensive, non-redundant databases for bacterial proteomics.
In conclusion, the depth and relatively straightforward nature of our workflow should make it a powerful new tool in the detection of biomarkers of diseases of the oral cavity as well as facilitate complementary studies of the microbiome in different contexts. In particular, proteomics appears uniquely positioned to study the interplay of the human immune system with commensurate and pathogenic bacteria at the systems level. We hope that such approaches will help to open new avenues in clinical application and for microbiology in the future.

Reference: https://genomemedicine.biomedcentral.com/articles/10.1186/s13073-016-0293-0